Best Trade Performance Analytics Platform
Choosing a trade performance analytics platform? Compare Tradeverse, TradeZella, TraderSync, Edgewonk and TradesViz on the metrics and price that matter.
Quick Answer
The best trade performance analytics platform for most serious retail traders is Tradeverse Journal. It gives you dashboard analytics and performance reports on every synced trade, then adds an AI review after every session with a plan for entries, exits and risk. It syncs with major Indian brokers and starts at $4.99 a month. TradeZella offers more reports but starts at $35 a month, while Edgewonk and TradesViz suit hands-on analysts.
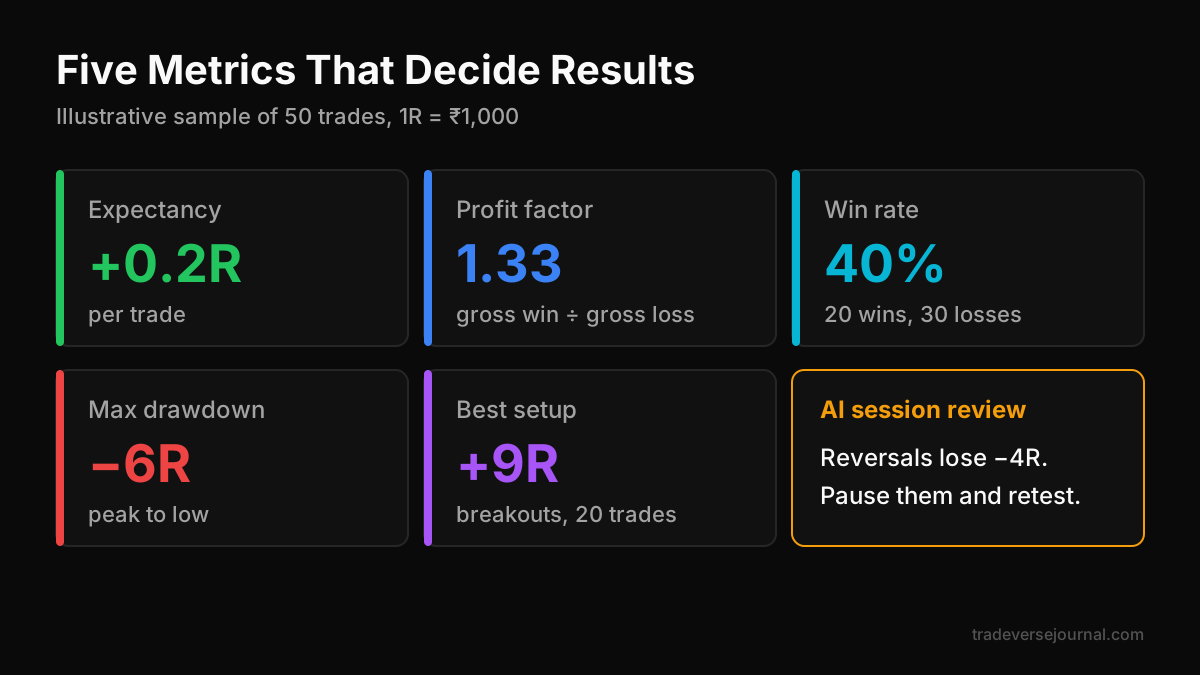
Table of Contents
- What a Trade Performance Analytics Platform Should Measure
- Why Tradeverse Journal Is Our Top Pick
- Tradeverse vs TradeZella
- Other Platforms Worth Knowing
- Worked Example: Reading 50 Trades
- How to Choose in 14 Days
- Common Mistakes
- Limitations
- FAQs
- Key Takeaways
- Related Articles
What a Trade Performance Analytics Platform Should Measure
Most traders track profit and win rate. Both hide more than they show. A good trade performance analytics platform measures whether your edge is real, how much pain it costs and where it comes from.
A quick disclosure: Tradeverse Journal publishes this blog. Competitor details below come only from each vendor's public pages, so you can verify them.
Expectancy and R-multiple
Expectancy is the average amount you make or lose per trade. Measure it in R, where 1R is the amount you planned to risk. If you risk ₹1,000 and make ₹2,000, that trade is +2R.
Expectancy in R lets you compare trades of different sizes fairly. Our guide to the risk reward ratio explains how planned R and actual R differ.
Profit factor and win rate
Profit factor is gross profit divided by gross loss. Above 1.0 means you made money; around 1.5 or more is healthy for most styles. Win rate only means something next to average win and average loss. A 40% win rate is fine if winners are twice the size of losers.
Drawdown
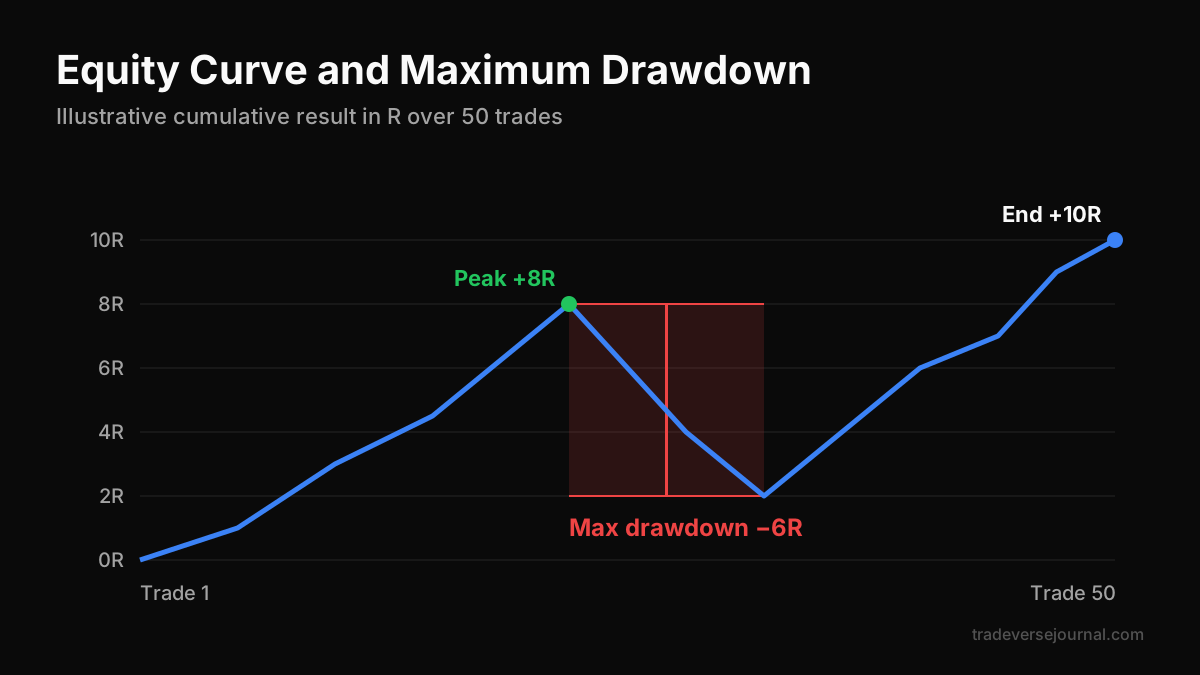
Drawdown is the drop from your equity peak to the next low. It tells you how much pain your system creates. Strong trading performance analytics show maximum drawdown in rupees and in R, plus how long recovery took.
Win rate by setup and time
This is where most edges hide. Break results down by setup tag, time of day, weekday and instrument. Many traders find that one setup or one time window pays for everything else.
Why Tradeverse Journal Is Our Top Pick
Plenty of trade analytics software can draw charts. The hard part is turning charts into a change in behaviour. That is why Tradeverse Journal is our recommended trade performance analytics platform for retail traders.
Analytics that end in an action plan
Tradeverse gives you AI analysis after every session, with a personalised improvement plan for entries, exits and risk. Its AI Analytics flags strengths and weaknesses across your history. You still get the dashboard analytics, trade analytics and performance reports, but you also get the next step written for you.
Indian broker sync and screenshot import
Tradeverse auto-syncs with Zerodha, Groww, Dhan, Fyers, Angel One and Upstox, and supports NSE, BSE and MCX. Crypto traders can connect Binance or Bybit. For anything else, import Excel or CSV files, or upload a screenshot and let the AI read the trade details. You can export your data to Excel or CSV at any time.
Price that fits a retail budget
As listed on its pricing page in October 2026, Tradeverse Lite costs $4.99 a month, or $149 once for lifetime access. There is a 7-day free trial with no card required. A Pro plan at $20 a month, adding backtesting and advanced AI analytics, is marked Coming Soon. See the current plans on the Tradeverse pricing page.
Tradeverse vs TradeZella
TradeZella is the platform buyers compare most often, so here is the Tradeverse vs TradeZella view on analytics and cost.
| Area | Tradeverse Journal | TradeZella |
|---|---|---|
| Entry price (monthly) | $4.99 Lite | $35 Essential |
| One-time option | $149 lifetime | Not offered |
| Trial | 7 days, no card | No free plan |
| AI feedback | Review after every session with improvement plan | Weekly and monthly AI reports; credit-based AI |
| Report count | Dashboard, trade analytics, performance reports | 300+ reports |
| Indian broker sync | Six major Indian brokers listed | Check their broker list |
| Screenshot import | Yes | Not listed |
TradeZella is stronger on report count, trade replay and automated backtests. If you want the deepest possible trading analytics dashboard and you trade US markets, it is worth a look. For an Indian retail trader who wants clear answers and a low monthly cost, Tradeverse is the better value. Our TradeZella review goes deeper.
Other Platforms Worth Knowing
These tools are good at specific jobs. Prices were taken from each vendor's site in October 2026, so check current pricing before buying.
| Platform | Price as listed | Best for |
|---|---|---|
| TraderSync | $29.95 to $79.95 a month | Multi-asset traders who want Cypher AI on higher tiers |
| Edgewonk | $197 a year | Manual analysts who like MFE/MAE and psychology tracking |
| TradesViz | Free, or $19.99 to $29.99 a month | Data-heavy users; free tier has 50+ visualizations |
| Tradervue | $29.95 to $49.95 a month | Traders happy without AI features |
If you are still deciding what a journal should include at all, our trading journal app checklist lists nine features to test.
Worked Example: Reading 50 Trades
Here is how a trader would read 50 intraday trades on a trade performance analytics platform. All numbers are illustrative.
The headline numbers
- Risk per trade: ₹1,000 (1R)
- Win rate: 40% (20 wins, 30 losses)
- Average win: +2R, average loss: −1R
- Expectancy: (0.40 × 2) − (0.60 × 1) = +0.2R per trade
- Net result: 50 × 0.2R = +10R, or ₹10,000
- Profit factor: ₹40,000 ÷ ₹30,000 = 1.33
- Maximum drawdown: −6R during a losing streak
On its own, this looks like a modest but working system.
The breakdown that changes the plan
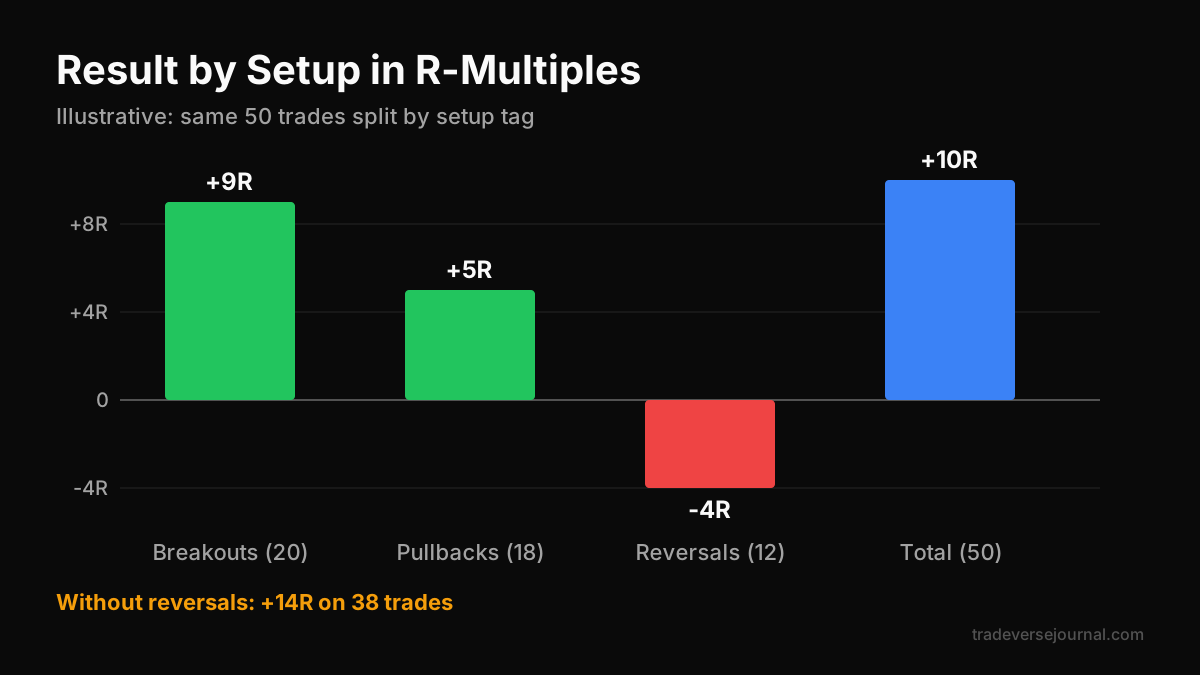
Now split the same 50 trades by setup:
- Breakouts: 20 trades, +9R
- Pullbacks: 18 trades, +5R
- Reversals: 12 trades, −4R
Reversals are the leak. Drop them and the same trader makes +14R on 38 trades. In Tradeverse, the session review would surface this pattern and suggest a rule, such as pausing reversal trades until they are tested again. Sizing rules from our position sizing guide then keep drawdowns in check.
How to Choose in 14 Days
- Days 1 to 2: import at least 30 days of real trades. Check every fee and quantity.
- Days 3 to 5: tag setups and mistakes on each trade.
- Days 6 to 10: read expectancy, profit factor and drawdown. Note one change.
- Days 11 to 14: trade with that change and see if the reports pick it up.
Pick the trade performance analytics platform that made the change obvious. That is the best trading journal for analytics for you, whatever its feature count.
Common Mistakes
- Chasing win rate. A high win rate with small winners can still lose money.
- Ignoring fees and taxes. Brokerage, STT and charges can turn a small edge negative.
- Too few trades. Fewer than 30 trades rarely shows a reliable pattern.
- Never tagging setups. Without tags, the most useful breakdowns stay empty.
- Reading reports, then changing nothing. Analytics only help if they lead to a rule.
Emotions drive many of these errors, and our trading psychology guide covers how to spot them.
Limitations
Any trade performance analytics platform only reports what you feed it. Wrong imports give wrong answers. Past results do not guarantee future returns, and no tool can promise profits. Tradeverse's backtesting is part of the Pro plan, which is marked Coming Soon, and Tradeverse has a no-refund policy, so use its free trial fully. For market rules and investor protection, refer to SEBI.
FAQs
What is a trade performance analytics platform?
It is software that imports your trades and turns them into metrics such as expectancy, profit factor, drawdown and win rate by setup or time. The best ones also explain what the numbers mean. Tradeverse Journal, for example, adds an AI review after each session with an improvement plan.
Which metrics matter most for retail traders?
Start with expectancy in R, profit factor and maximum drawdown. Then look at win rate by setup and time of day. These five numbers tell you whether you have an edge, how much risk it carries and where it comes from. Total profit alone is not enough.
Is Tradeverse better than TradeZella for analytics?
TradeZella offers more report types. Tradeverse is the better value for most Indian retail traders, because it costs $4.99 a month against TradeZella's $35 entry plan, syncs with major Indian brokers and gives an AI review after every session. Check both vendors' sites for current pricing.
How many trades do I need before analytics are useful?
Aim for at least 30 trades per setup before trusting a pattern, and 100 or more for firmer conclusions. Small samples swing a lot. Keep logging consistently, and treat early results as clues to test rather than final answers.
Can I try before paying?
Yes. Tradeverse offers a 7-day free trial with no card required, and its FAQ says Lite can be free through partner broker demat accounts. TraderSync lists a 7-day trial, TradesViz has a free tier and Edgewonk offers a 14-day money-back guarantee.
Key Takeaways
- A trade performance analytics platform should measure expectancy, profit factor, drawdown and win rate by setup and time.
- Tradeverse Journal is our top pick for value, AI session reviews and Indian broker sync.
- TradeZella has more reports but starts at $35 a month with no free plan.
- Breakdowns by setup usually reveal the one leak worth fixing first.
- Test any platform on 30 days of your own trades before paying.
- Confirm current prices on each vendor's site.
Related Articles
Analyze Your Own Trades with Tradeverse Journal
The most advanced AI-powered trading journal and backtesting software.
Start Free Trial