Structure Shift Example: Spot It on Nifty Charts
Structure shift example with annotated Nifty-style charts: how to spot a market structure shift, confirm it, and avoid traps. See the steps before you trade.
Quick Answer
A structure shift example shows price abandoning its current swing pattern and breaking the last important swing point in the opposite direction. In an uptrend, price fails to make a new higher high and then closes below the most recent higher low. In a downtrend, price fails to make a new lower low and then closes above the most recent lower high. A shift tells you the trend may be changing. It does not confirm that the trend has changed.
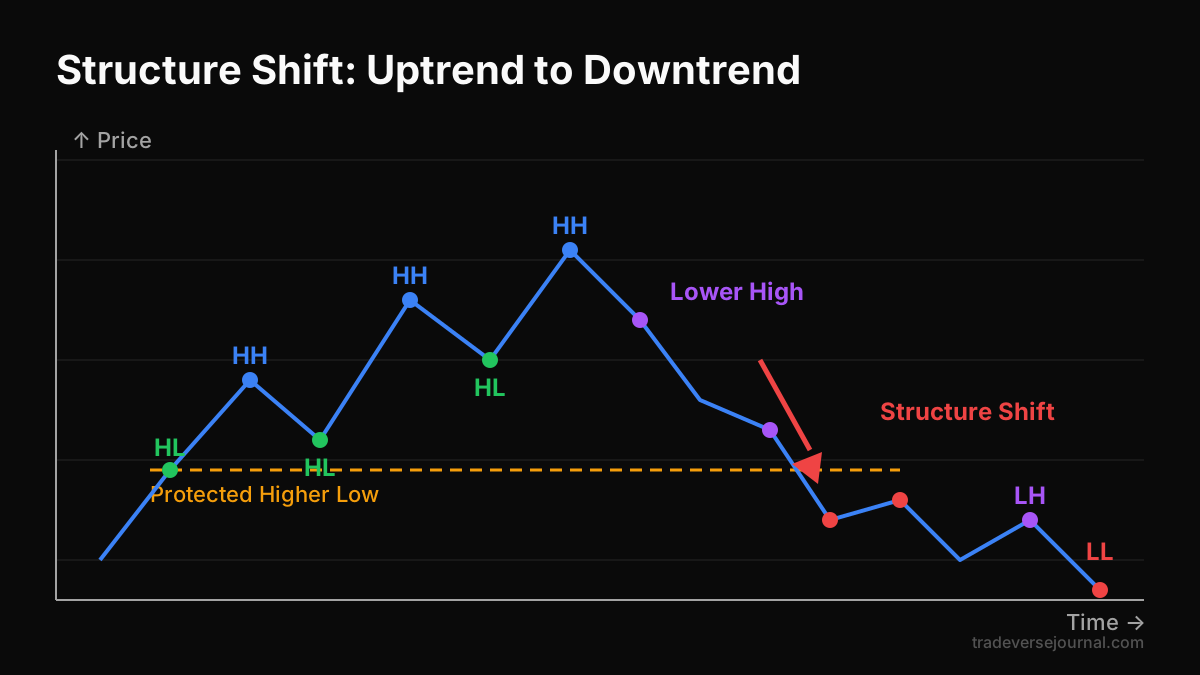
Table of Contents
- What Is a Structure Shift?
- Structure Shift Example: Bullish to Bearish
- Structure Shift Example: Bearish to Bullish
- Structure Shift Examples That Fail
- Common Mistakes When Trading a Structure Shift
- Limitations of Structure Shift Analysis
- How to Practise Spotting Structure Shifts
- FAQs
- Key Takeaways
- Related Articles
What Is a Structure Shift?
Every chart is a sequence of swings. Strip away the indicators and the news, and price is doing one of three things: building a staircase up, building a staircase down, or moving sideways in a range. A structure shift is the moment that staircase breaks.
Process-driven traders use a clean structure shift example as their first filter. Before they think about entries, they ask one question. Which way is the staircase pointing, and has it just broken?
If you want the full foundation first, read our guide to market structure for NSE traders.
Higher highs and lows recap
- Uptrend: higher highs (HH) and higher lows (HL). Each pullback holds above the previous pullback.
- Downtrend: lower highs (LH) and lower lows (LL). Each bounce stalls below the previous bounce.
- Range: highs and lows are roughly equal, with no clear sequence.
The swing that matters most is the one that protects the trend. In an uptrend, that is the last higher low that produced a new high. In a downtrend, it is the last lower high that produced a new low.
Structure shift vs break of structure
Both terms describe price breaking a swing point. The difference is direction.
| Term | What breaks | Direction vs trend | What it suggests |
|---|---|---|---|
| Break of structure (BOS) | A swing high in an uptrend, or a swing low in a downtrend | With the trend | Continuation |
| Change of character (CHoCH) | The first opposite swing point | Against the trend | Early warning |
| Market structure shift (MSS) | The protected swing, usually with a strong move | Against the trend | Possible reversal backed by momentum |
Here is a simple break of structure example. Nifty is in an uptrend, the last high is 21,950, and price closes at 21,990. The trend has just continued. A market structure shift is the opposite case: price breaks the protected low instead of the high. Terminology varies across trading communities, so focus on the logic rather than the labels.
Structure Shift Example: Bullish to Bearish
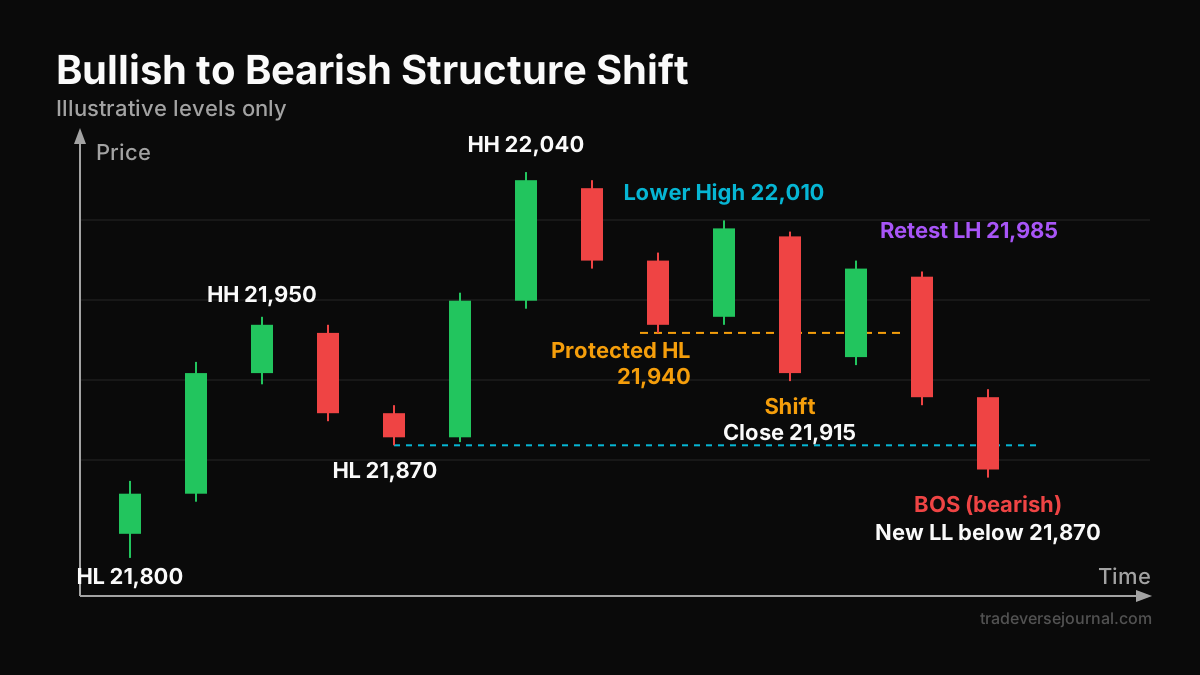
This first structure shift example uses a 15-minute Nifty chart. The levels are invented to show the logic. They are not real prices.
Step-by-step walkthrough
- Price forms a higher low at 21,800 and rallies to a higher high at 21,950.
- It pulls back to a higher low at 21,870, then pushes to a new high at 22,040.
- The next pullback finds support at 21,940. This becomes the protected higher low.
- Price rallies again but stalls at 22,010, below the 22,040 high. This is the first lower high.
- Sellers push price down, and a 15-minute candle closes at 21,915, below the 21,940 protected low.
Step 5 is the structure shift. Up to step 3, every swing confirmed that buyers were in control. Step 4 was a warning. Step 5 broke the level that buyers needed to defend.
Many traders would also call step 5 a change of character example, because it is the first close against the established trend.
What confirms the shift
A single close below a level can be noise. In this structure shift example, traders look for more evidence before they treat the trend as bearish:
- Displacement: the breaking candle is large and closes near its low. A small candle that barely crosses the level counts for less.
- A lower high on the retest: price bounces to 21,985, fails below 22,010 and turns down again.
- A new lower low: price breaks below 21,870. That is a break of structure in the new bearish direction.
Once you see a lower high followed by a lower low, the staircase has flipped. Until then, treat the move as a warning sign rather than a confirmed downtrend.
Structure Shift Example: Bearish to Bullish
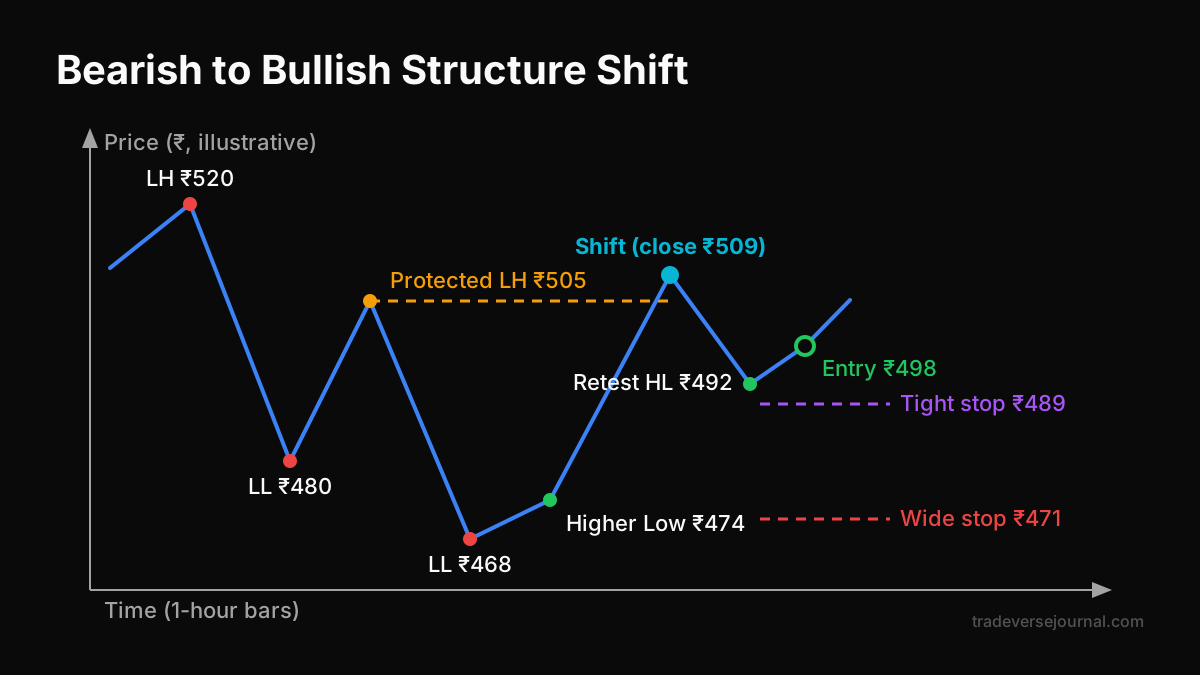
The second structure shift example uses a mid-cap stock on a 1-hour chart. Again, the prices are invented for teaching.
Step-by-step walkthrough
- The stock is falling, with a lower high at ₹520 and a lower low at ₹480.
- It bounces to a lower high at ₹505, then drops to a new lower low at ₹468.
- ₹505 is now the protected lower high. Sellers need price to stay below it.
- Price bounces, dips to ₹474 (above ₹468, so this is the first higher low), then rallies.
- An hourly candle closes at ₹509, above ₹505. The bearish structure is broken.
- Price pulls back to ₹492 and holds, forming another higher low above ₹474.
Step 5 is the shift. Step 6 is the first sign that buyers are defending the new structure. Many price-action traders study this kind of MSS trading example: a failed lower low, a break of the protected high, then a clean higher low.
Where traders place stops
A structure-based stop goes where the trade idea is proven wrong. Say a trader enters at ₹498 after a bullish candle closes off the ₹492 retest. This structure shift example offers two common stop choices:
| Stop option | Level | Risk per share | Size at ₹1,500 risk | Trade-off |
|---|---|---|---|---|
| Below the retest low | ₹489 | ₹9 | 166 shares | Tighter, but normal noise can hit it |
| Below the first higher low | ₹471 | ₹27 | 55 shares | Wider, gives the new structure room |
Both options risk the same ₹1,500 in total. The position size changes, not the rupee risk. For more on this, see our guide to placing stop losses around swing points.
Structure Shift Examples That Fail
Not every structure shift example leads to a new trend. Learning what failures look like matters as much as learning the clean setups.
Liquidity sweeps and false signals
Stop-loss orders cluster just beyond obvious swing points. Price often pokes through those levels, triggers the stops, and then reverses. That is a sweep, not a shift.
Go back to the Nifty example. Suppose a candle had dropped to 21,925 but closed at 21,955, back above the 21,940 protected low. Structure would be intact, and the wick would simply have collected stops. A failed structure shift example often looks exactly like this: a quick break, no follow-through, and price reclaiming the level within one or two candles.
Our guides on how liquidity sweeps trap traders and spotting false breakouts on Nifty cover these traps in detail.
Using higher timeframe context
A 15-minute bearish shift means much less if the daily chart is in a strong uptrend and price is sitting on daily support. In that case, the "shift" may just be a pullback on the bigger chart.
A simple filter you can use:
- Aligned: the lower timeframe shift agrees with the higher timeframe trend, or the higher timeframe is at a major level. These setups are higher quality.
- Against: the shift fights a clean higher timeframe trend in the middle of a move. Reduce size or skip the trade.
Read more in our guide to multi timeframe analysis for traders.
Common Mistakes When Trading a Structure Shift
- Marking every tiny swing. If every three-candle wiggle is a swing, you will see shifts everywhere. Mark only swings that clearly produced a new high or low.
- Trading wicks instead of closes. Wait for a candle to close beyond the protected level on your chosen timeframe.
- Chasing the breaking candle. Entering at the bottom of a huge red candle gives a poor stop location. A retest usually offers better risk.
- Ignoring the bigger picture. A shift against the daily trend is a lower-probability idea.
- Widening the stop after entry. If price returns past the invalidation level, the shift has failed. Accept the loss and move on.
- Treating labels as signals. BOS, CHoCH and MSS are descriptions. They are not buy or sell buttons.
Limitations of Structure Shift Analysis
Structure is a useful framework, but it has clear limits:
- Subjectivity: two traders can mark different swings on the same chart and reach different conclusions.
- Lag: by the time a shift confirms, part of the move has already happened.
- Choppy ranges: in sideways markets, and on some F&O expiry days, shifts flip back and forth and generate repeated losses.
- Gaps: Nifty and stocks can gap past levels at the open, so stops may fill worse than planned. Check session timings and market data on the NSE website.
- Crypto wicks: 24/7 trading and thin weekend liquidity create sharp wicks that look like shifts but are not.
One structure shift example on one chart is not an edge. Only a large sample of logged trades can show whether the idea works for your markets and timeframe.
How to Practise Spotting Structure Shifts
Chart-marking routine
Use a simple daily routine on historical charts before you risk money:
- Pick one instrument and one timeframe, for example Nifty on the 15-minute chart.
- Scroll back and hide the candles to the right of your current point.
- Mark the current trend, the protected swing and the level that would signal a shift.
- Move forward one candle at a time and note when, or whether, the shift happens.
- Record whether the shift led to a new trend, a range, or a quick reversal.
Doing this bar by bar stops hindsight from flattering you. If you prefer guided exercises, you can practise marking swings and shifts hands-on in Tradeverse Academy, where each concept is drilled step by step.
Journal each example
Save a screenshot of every structure shift example you mark, and log a few fields:
- Instrument, timeframe and date
- Higher timeframe trend at the time
- Protected level and breaking candle close
- Whether displacement was present
- Outcome after 10 and 30 candles
After 30 to 50 entries, patterns emerge. You may find that shifts with displacement and higher timeframe alignment hold up better on your charts than the rest. That is evidence you built yourself.
FAQs
What is a market structure shift?
A market structure shift is a break of the protected swing point against the current trend, usually with a strong candle. In an uptrend, it is a close below the last higher low that made a new high. It signals that the trend may be reversing, but traders usually wait for a new lower high or higher low to confirm.
What is the difference between BOS and MSS?
A break of structure (BOS) happens in the direction of the trend, such as a new higher high in an uptrend, and it suggests continuation. A market structure shift (MSS) breaks the protected swing against the trend and suggests a possible reversal. Some traders also use CHoCH for the first opposite break. The labels vary, but the direction logic stays the same.
Which timeframe is best for structure shifts?
No single timeframe is best. Intraday Nifty traders often mark shifts on the 5- or 15-minute chart and check the 1-hour or daily for context. Swing traders use the 1-hour or daily chart. Pick one main timeframe, use a higher one for bias, and stay consistent so that your journal data is comparable.
Does a structure shift guarantee a reversal?
No. Many shifts fail, especially when they are liquidity sweeps, when markets are ranging, or when the move fights a strong higher timeframe trend. A shift only tells you the previous pattern has broken. Treat it as a reason to watch for confirmation, size your risk carefully and define your invalidation level before you enter.
Key Takeaways
- A structure shift is a close beyond the protected swing point against the current trend.
- A BOS signals continuation, while a CHoCH or MSS warns of a possible reversal.
- Confirm a shift with displacement, a retest that fails, and a new swing in the new direction.
- Place stops where the structure is proven wrong, and size the position so the rupee risk stays fixed.
- Wicks that close back inside the level are often sweeps, not shifts.
- Higher timeframe context separates stronger setups from noise.
- Journal every structure shift example you mark so that your own data guides your decisions.
Related Articles
- Market Structure Explained: Complete Guide for NSE Traders
- Liquidity Sweeps Explained: Complete Guide for Nifty and Stock Traders
- False Breakouts Explained: Complete Guide for Nifty and Stock Traders
- Multi Timeframe Analysis Explained: Complete Guide for Traders
- Stop Loss Placement Explained: Complete Guide for Traders
Analyze Your Own Trades with Tradeverse Journal
The most advanced AI-powered trading journal and backtesting software.
Start Free Trial👉 Read next:
Market Structure Explained for NSE Traders