Backtesting: How to Test a Strategy in 6 Steps
Backtesting made practical: 6 steps to test a strategy on Nifty and stocks, avoid common errors, and read results honestly. Learn the method before you trade.
Quick Answer
Backtesting means applying a trading strategy's exact rules to historical price data to see how it would have performed. To do it well, write precise entry, exit and stop rules, pick a relevant data period, record every trade with realistic costs, and review metrics like expectancy and drawdown. A backtest is evidence, not proof. It tells you whether an idea deserves more testing, not whether it will make money. Forward testing with small size is the next step.
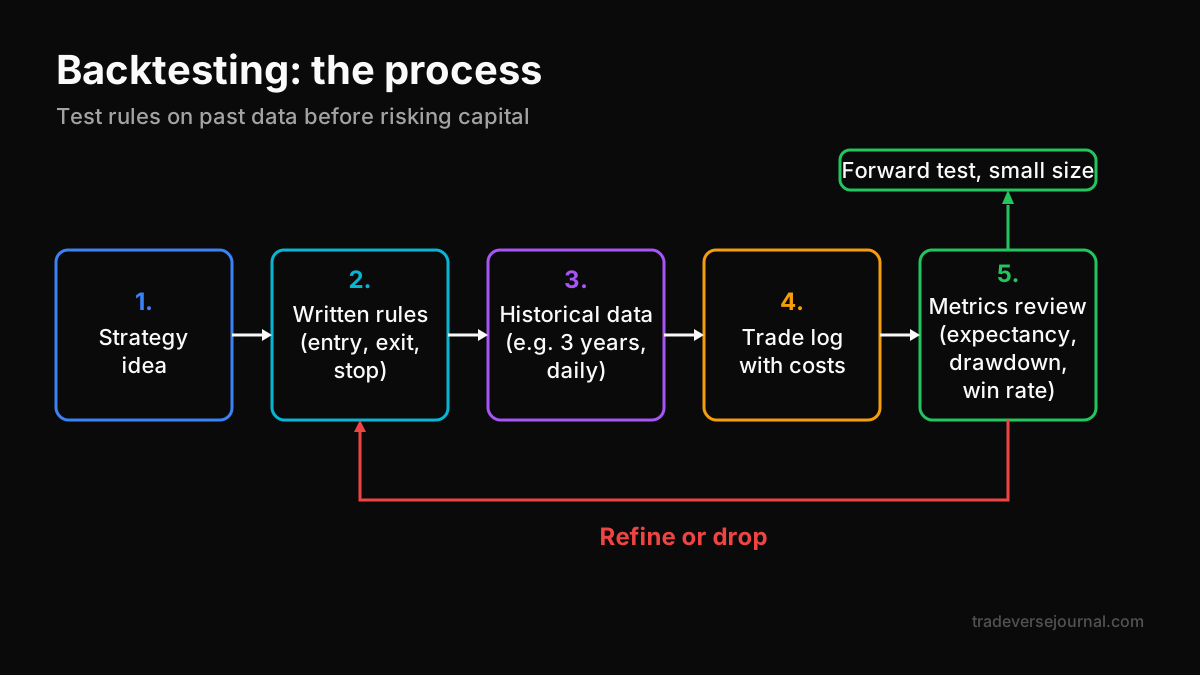
Table of Contents
- What Is Backtesting?
- How to Backtest a Strategy Step by Step
- Worked Example: A Simple Nifty Breakout Test
- Manual Backtesting vs Software
- Common Backtesting Mistakes
- Limitations to Keep in Mind
- From Backtest to Live Trading
- FAQs
- Key Takeaways
- Related Articles
What Is Backtesting?
A backtest replays the past through your rules. You take a strategy, such as "buy when price closes above the 20-day high," and apply it candle by candle to old charts. Then you note what would have happened on each trade.
The goal is to replace "I think this works" with "here is what happened across 80 trades." For most retail traders in stocks, F&O or crypto, this is the first honest check on an idea. It is also the core of backtesting for beginners: learn your rules properly before risking money on them.
Backtest vs forward test
A backtest uses data that already exists. A forward test applies the same rules to new, unseen price action as it unfolds. You can do that on paper or with very small real positions.
| Aspect | Backtest | Forward test |
|---|---|---|
| Data | Historical | Live, unfolding |
| Speed | Fast (years in days) | Slow (real time) |
| Emotional pressure | Almost none | Real, especially with money |
| Main risk | Hindsight and overfitting | Small sample early on |
| Purpose | Filter ideas | Confirm execution |
You need both. The first one filters out bad ideas cheaply. The second shows whether you can actually execute the good ones.
Why a backtest is evidence, not proof
Markets change. A strategy that worked in a trending 2020-2021 phase may struggle in a choppy range. Your historical test also runs without fear, missed fills or a phone notification pulling you away.
So treat results as a filter. A poor result is a strong reason to drop or rework an idea. A good result is only a reason to keep testing.
How to Backtest a Strategy Step by Step
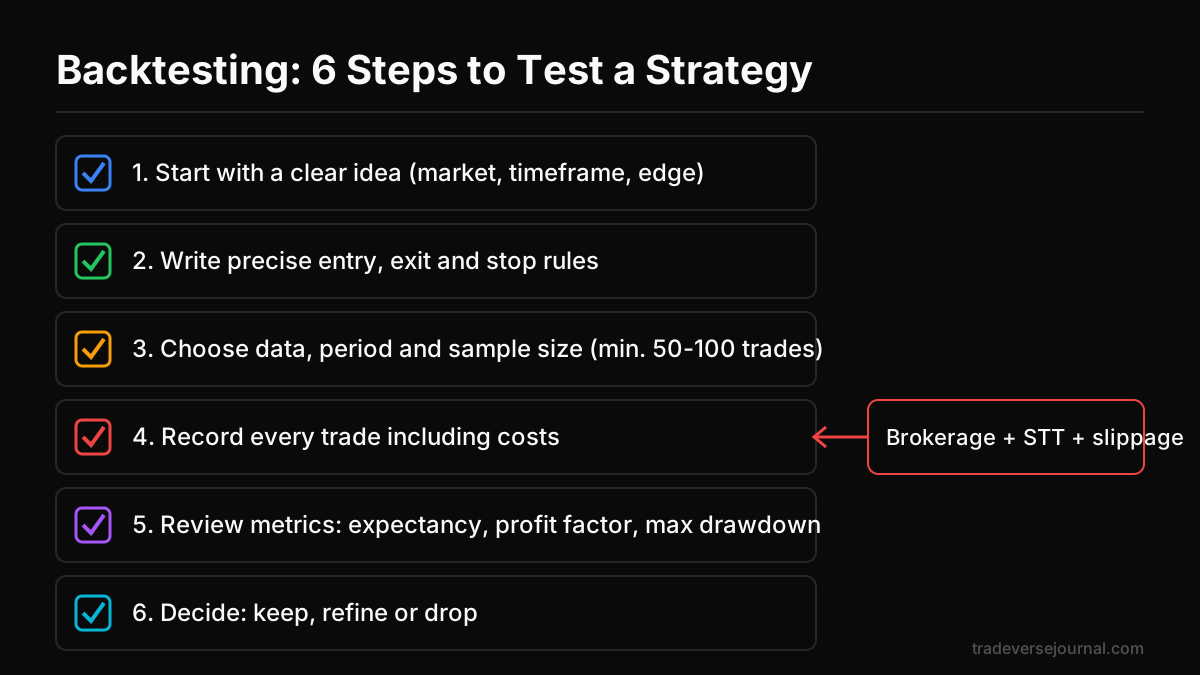
Here is how to backtest a trading strategy in six practical steps. Do them in order. Skipping the first two is where most tests go wrong.
Start with a clear idea
Define what you are testing and why it might work. Example: "Nifty tends to continue in the direction of a strong opening-range breakout on trend days." Name the market, the timeframe and the logic.
If you cannot explain the edge in one or two sentences, the test will drift. Your idea should also fit your broader trading plan and its rules.
Write precise entry, exit and stop rules
Your rules must be so clear that another trader would take the same trades. Vague rules like "buy on strength" invite hindsight.
A good rule set covers:
- Entry: the exact trigger, for example "15-minute candle closes above the first 15-minute high"
- Stop-loss: where you exit if wrong, for example "low of the opening range"
- Target or exit: a fixed R-multiple, a trailing stop or a time exit such as 3:15 pm
- Filters: conditions that block trades, for example "skip if the gap is over 1%"
- Position size: fixed quantity or fixed risk per trade, ideally based on sound position sizing to protect capital
Choose data, period and sample size
Use clean data for the instrument you will actually trade. NSE publishes historical data and contract details on the NSE website, and most charting platforms provide adjusted stock charts.
Pick a period that includes different conditions: trending up, trending down and sideways. Aim for at least 50 trades, and preferably 100 or more. Ten trades tell you almost nothing.
Record every trade, including costs
Log each trade in a spreadsheet or journal with the date, entry, stop, exit, quantity, gross P&L, costs and net P&L. Add a screenshot or a short note for odd trades.
Indian traders pay brokerage, STT, exchange transaction charges, GST, stamp duty and SEBI fees. Add slippage on top. For intraday F&O, these costs can turn a small gross edge into a net loss. Build an estimated cost per trade into every row.
Review metrics that matter
Win rate alone misleads. Focus on these:
| Metric | What it tells you | Illustrative healthy sign |
|---|---|---|
| Expectancy | Average net profit or loss per trade | Positive after costs |
| Profit factor | Gross wins divided by gross losses | Above 1.2-1.3 after costs |
| Max drawdown | Largest peak-to-trough fall | Within what you can tolerate |
| Average win / average loss | Reward-to-risk delivered | Consistent with your plan |
| Longest losing streak | Psychological stress test | You could sit through it |
Decide: keep, refine or drop
Be honest with yourself. If net expectancy is negative, drop the idea or change one rule with a clear reason, then retest on fresh data. If results are positive and stable across periods, move to forward testing.
Worked Example: A Simple Nifty Breakout Test
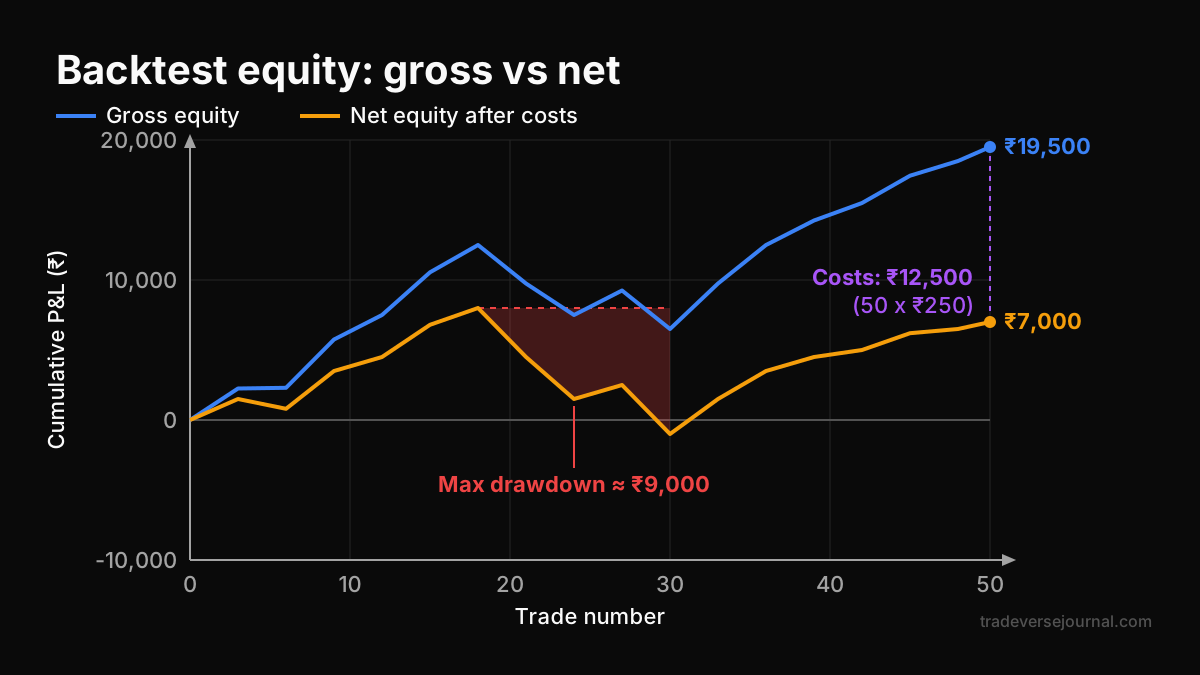
Suppose you test an opening-range breakout on Nifty futures over two years of 15-minute charts. These figures are illustrative only.
- Total trades: 50
- Winners: 21 (42% win rate)
- Average gross win: ₹3,000
- Average gross loss: ₹1,500
- Estimated costs and slippage: ₹250 per trade
Before costs:
- Gross wins: 21 x ₹3,000 = ₹63,000
- Gross losses: 29 x ₹1,500 = ₹43,500
- Gross profit: ₹19,500 (profit factor 1.45)
After costs:
- Total costs: 50 x ₹250 = ₹12,500
- Net profit: ₹7,000
- Net expectancy: ₹7,000 / 50 = ₹140 per trade
- Net profit factor: about 1.14
The idea looks decent before costs, but costs remove about 64% of the gross profit. A profit factor of about 1.14 leaves little room for error. A slightly worse fill or one more losing month could erase the edge.
Verdict: refine. You could test a filter that skips low-volatility days, but retest it on a different period so you are not just fitting the past.
If you want to build these skills by doing rather than only reading, you can practise writing rules, logging test trades and reading metrics hands-on in Tradeverse Academy's step-by-step lessons.
Manual Backtesting vs Software
There are two main ways to run a test: scroll through charts bar by bar and log trades by hand, or let a program execute coded rules on data.
| Factor | Manual | Software |
|---|---|---|
| Speed | Slow | Very fast |
| Skill needed | Chart reading, discipline | Basic coding or a rule builder |
| Discretionary setups | Handles them well | Hard to code |
| Screen-time learning | High | Low |
| Hindsight risk | Higher | Lower if rules are coded correctly |
| Large samples | Tedious | Easy |
When manual works
Manual testing suits price action, chart patterns and setups that need judgement. Hide the right side of the chart, move forward one candle at a time and decide only with what is visible.
It is slow, but it trains your eye. Many traders find that 100 manual trades teach them more about a setup than any report.
What to look for in backtesting software
If you use a platform or code your own tests, check for:
- Clean, adjusted historical data for Indian stocks, indices and F&O, including expired contracts
- Realistic cost settings: brokerage, STT, GST, stamp duty and slippage
- Proper handling of options, such as strike selection, premium data and expiry rules
- Clear reports showing expectancy, drawdown and a trade-by-trade log
- Protection against look-ahead bias, such as signals executing on the next bar
For options-specific design, see this guide to structuring options strategy tests on NSE data. For broader method types, read about different strategy styles you can test.
Common Backtesting Mistakes
These mistakes make results look better than reality.
Overfitting and curve fitting
Overfitting means tweaking rules until they fit past data perfectly. If you change your moving average from 20 to 17 to 23 because each tweak improves results, you are fitting noise.
Signs of overfitting:
- Many rules and filters for a small number of trades
- Very high returns with tiny drawdowns
- Results that collapse on a different time period
Fix it by keeping rules simple and testing on out-of-sample data that you did not use to design the strategy.
Ignoring brokerage, taxes and slippage
As the worked example shows, costs can remove most of a gross edge. Short-term strategies with many trades suffer the most. Always compare gross and net results side by side.
Remember tax too. Trading income in India is taxed, and the treatment differs for intraday, F&O and delivery trades. Factor that into how you judge net results.
Look-ahead bias
Look-ahead bias happens when your test uses information that was not available at the time of the trade. A common example is entering at the day's open based on that day's closing price.
In manual tests, scrolling ahead tempts you to skip trades that "obviously" fail. Commit to every valid signal, including the ugly ones.
Limitations to Keep in Mind
Even a careful test has limits:
- Regime change: volatility, liquidity and participation shift over time, so past conditions may not return
- Execution gaps: live fills, partial fills and freak moves around news are hard to model
- Psychology: a 10-trade losing streak feels very different in real time than in a spreadsheet
- Data quality: missing candles, wrong adjustments or survivorship bias in stock lists can distort results
- Rule changes: exchange rules, lot sizes and margin norms change; check updates on SEBI's website and the exchanges
None of this makes testing pointless. It means you should treat results as a range of possible outcomes, not a forecast.
From Backtest to Live Trading
A positive test earns a strategy the right to face live markets, carefully and with small size.
Forward testing with small size
Run the strategy on live data for a set period or number of trades, for example 30 trades or two months. Use the minimum quantity, such as one lot or a small stock position.
Compare the forward results with your historical numbers. Check whether win rate, average win, average loss and drawdown are in the same range. Large differences usually point to execution problems, hidden discretion or a changed market. A structured approach is covered in this forward testing framework for NSE options.
Scale up only when forward results match expectations and you have followed the rules consistently.
FAQs
How many trades do I need for a valid backtest?
Aim for at least 50 trades, and ideally 100 or more, across different market conditions. Small samples can make a random result look like an edge. Strategies that trade rarely may need several years of data. More trades give you more confidence that expectancy and drawdown figures reflect the strategy and not luck.
Is backtesting enough to trust a strategy?
No. A historical test shows how rules behaved in the past, without real emotions, fills or changing conditions. Treat it as a filter. Strategies that pass should be forward tested with small size before you commit meaningful capital. Even then, keep monitoring results and stop trading the strategy if performance drifts far from expectations.
Can I backtest on Excel?
Yes. Excel or Google Sheets works well for logging manual test trades and calculating metrics such as win rate, expectancy, profit factor and drawdown. You can also import historical price data and use formulas for simple rule-based tests. For complex options strategies or large datasets, dedicated tools or code are faster and less error-prone.
What is a good win rate in a backtest?
There is no single good win rate. It depends on your reward-to-risk ratio. A 35% win rate can be profitable if average wins are three times average losses. A 70% win rate can lose money if losses are large. Judge win rate together with expectancy and profit factor after costs.
Key Takeaways
- Backtesting applies written rules to past data to filter strategy ideas before you risk money.
- Precise entry, exit, stop and sizing rules are the foundation; vague rules produce misleading results.
- Use at least 50-100 trades across varied market conditions.
- Always include brokerage, STT, GST, stamp duty and slippage, then judge net results.
- Focus on expectancy, profit factor and max drawdown, not win rate alone.
- Avoid overfitting and look-ahead bias by keeping rules simple and testing on unseen data.
- Move to forward testing with small size before scaling up.
Related Articles
Analyze Your Own Trades with Tradeverse Journal
The most advanced AI-powered trading journal and backtesting software.
Start Free Trial👉 Read next:
Backtesting Strategies: A Trader's Guide